Some issues with Application Under Tests (AUT) appear only when a test is executed with Squish. For some cases, it's easier run our test scenario with Squish than repeating it manually. To get a detailed information about the state of our AUT during a test execution, you can attach to it with an external debugger (gdb/lldb).
How to do it?
-
-
- Put a breakpoint after startApplication/attachToApplication in the Squish IDE.
- Start a Test Case in the Squish IDE and wait until a breakpoint is reached.
- Attach gdb/lldb to the running process (gdb has an "attach PID" command or -p parameter during startup).

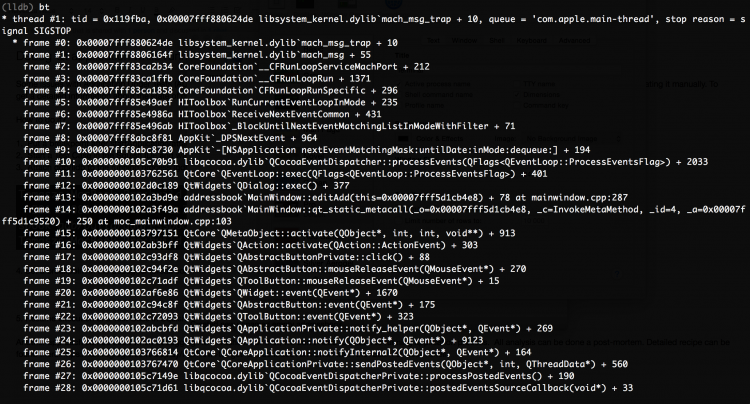
- Set a breakpoint in the debugger (break command) and resume (continue command) OR display a backtrace (bt command)
- Resume execution of a Test Case in Squish IDE.
Another approach can be used when debugging AUT crashes. For that, we don't need to attach to running application process. All analysis can be done a post-mortem. Detailed recipe can be found in How to get a backtrace on Unix with the bash or tcsh shell article.
-